AI Agent Observability: What to Monitor First
What you'll learn
- What AI agent observability actually means, and how it differs from normal app monitoring
- Why agents fail in ways that look like success on the surface
- The four signals worth tracing: full runs, tool calls, reasoning steps, and cost
- Why most businesses running agents today have little or no observability in place
- A practical checklist for adding observability before you scale an agent
AI agent observability is the practice of tracing what an agent actually did, step by step, tool call by tool call, decision by decision, so you can tell why it produced a given result instead of just seeing the final answer. Normal application monitoring tells you a request succeeded. Agent observability tells you what the agent read, what it decided, which tools it called, and what that run cost, which is the only way to catch an agent that is confidently wrong instead of visibly broken.
TL;DR: an agent can fail while looking like it succeeded, a well-formed answer built on the wrong tool call or stale context. Traditional monitoring cannot catch that because it only checks whether the request completed, not whether the path the agent took made sense. Trace the full run, not just the output, log every tool call and the reasoning that led to it, track cost per run so it does not creep up unnoticed, and set up evaluations that catch quality drift automatically. Most businesses running agents today have none of this in place, which is exactly why so many pilots stall before they reach production scale.
Why Normal App Monitoring Misses Agent Failures
Standard monitoring is built around a simple assumption: the same input produces the same output, and an error throws a visible exception. Neither assumption holds for an AI agent. Temperature, retrieval results, and which tools happen to be available can all change the path an agent takes on two runs of the identical request. An agent does not usually crash when it gets something wrong. It returns a fluent, well-formatted, completely wrong answer, and every dashboard built for traditional software will show that request as a success.
This is the core problem with treating agent monitoring like web application monitoring. A web app either returns the right page or throws an error. An agent can call the wrong tool, read stale or incomplete context, skip a step it should have taken, and still hand back something that reads perfectly well. Without visibility into the steps in between, that failure is invisible until a customer, or a much bigger incident, surfaces it for you.
The Four Signals Worth Tracing
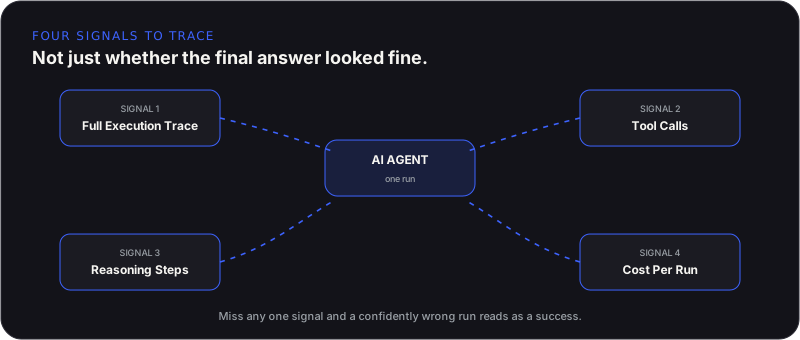
Observability for agents comes down to capturing four things, not just one output log line.
- Full execution traces: the entire path a run took, not just the final answer, so you can replay exactly what happened when something looks off
- Tool calls: which tools the agent called, with what arguments, and what came back, since this is usually where a bad decision first becomes visible
- Reasoning steps: the intermediate decisions the agent made along the way, so you can tell whether it reached the right answer for the right reason or the right answer for the wrong one
- Cost per run: tokens and dollars spent on each individual run, not just a monthly total, so a single runaway loop or an inefficient prompt shows up before it becomes next month's bill
Why This Gap Exists at Almost Every Business Running Agents
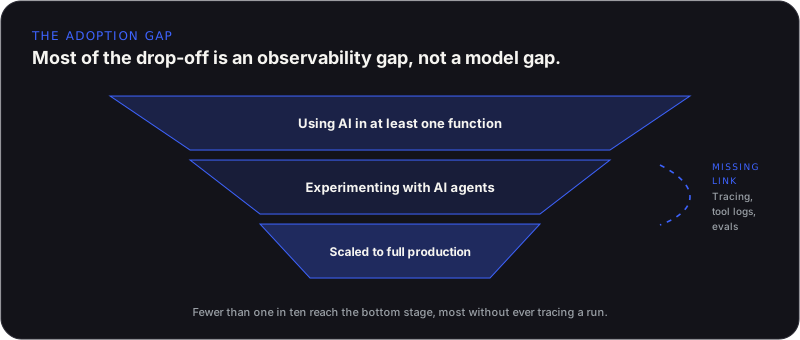
Adoption of AI agents has moved fast. McKinsey’s State of AI research puts the share of organizations using AI in at least one business function at 88%, and 39% more say they are at least experimenting with agents. Observability has not kept pace with that adoption curve. The same research finds that no more than 10% of organizations are scaling AI agents within any single business function, the gap between piloting an agent and running one in production at real scale.
That gap is not a coincidence. Teams can pilot an agent for weeks on a small, friendly dataset without ever needing to know exactly why it made a given call, because someone is watching every output by hand. That approach breaks the moment volume grows past what a person can manually review. The businesses stuck at the pilot stage are, more often than not, stuck there because nobody can explain what the agent actually does at scale, not because the agent itself stopped working.
Traces, Logs, and Evals Are Not the Same Thing
These three terms get used interchangeably, but they answer different questions, and a complete setup needs all three.
- Logs tell you an event happened: a tool was called, a request came in, a response went out
- Traces tell you the full path a single run took, connecting every step, tool call, and decision into one timeline you can replay
- Evals tell you whether the output was actually good, scored against a rubric or a reference answer, run automatically across many runs rather than checked by hand
Logs alone tell you the agent ran. Traces tell you how. Evals tell you whether the how produced something worth shipping. Skip any one of the three and you are left guessing at exactly the part of the picture you skipped.
What Good Observability Looks Like in Practice
A working setup does not require building a monitoring platform from scratch. It requires instrumenting the agent so every run emits a trace, every tool call is logged with its inputs and outputs, cost is tracked per run rather than only in aggregate, and a sample of runs is scored automatically against defined quality criteria, with alerts when that score drops. When something goes wrong, the question stops being "what happened," which takes hours of guessing and re-running, and becomes "here is the trace," which takes minutes to read.
This is also where the connection layer between an agent and your systems matters. If your agent reaches your CRM, your support desk, and your internal tools through a standardized integration, an MCP server, that same layer is a natural place to centralize logging and permissions, instead of instrumenting each tool connection separately. The fewer places access and logging live, the easier the whole system is to audit later.
A Practical Checklist Before You Scale an Agent
- Every run produces a full trace you can open and replay, not just a final output log
- Every tool call is logged with its arguments and its result, not just the fact that a tool was used
- Cost is tracked per run, so a single expensive or looping run is visible before it shows up in a monthly bill
- A sample of runs is scored automatically against quality criteria, and someone is alerted when that score drops
- You can answer "why did the agent do that" from a trace in minutes, without re-running the request and hoping it fails the same way twice
- Observability was built in from the start of the deployment, not added after the first confusing incident
This Connects Directly to ROI and Security
Observability is not a separate concern from the other questions businesses ask about agents. You cannot measure AI agent ROI accurately without per-run cost data and a real error rate, both of which come from the same instrumentation this article covers. And the defense-in-depth controls that stop prompt injection depend on logging every tool call and decision, the same signals that make an agent debuggable in the first place. Observability, cost measurement, and security are three views of the same underlying data, not three separate projects.
It matters even more once an agent is not the only one running. A multi-agent setup fails most often at the handoff between agents, and that kind of failure is invisible without tracing that follows a task across every agent it touches, not just logging inside each agent individually.
How We Approach This at Agentiq Studios
When we deploy a custom agent for a client, tracing, tool call logging, and cost tracking go in during the build, not as a follow-up project after something breaks. A client should be able to open a trace and see exactly why an agent did what it did, the same way they would expect to see a log for any other piece of production infrastructure. An agent nobody can explain is not something we consider done, no matter how well the demo went.
Related from Agentiq Studios: AI Deployment & DevOps, Agentic Processes, and SaaS, where agent observability directly protects retention.
Final Thoughts
The gap between businesses piloting AI agents and businesses running them reliably at scale is, in most cases, an observability gap, not a model quality gap. An agent that looks broken gets fixed quickly. An agent that looks fine while quietly making the wrong call can run for weeks before anyone notices, and by then the cost is a lot higher than the cost of tracing it properly from day one. Build in tracing, tool call logging, and automatic evaluation before you scale, not after the first incident forces the question.